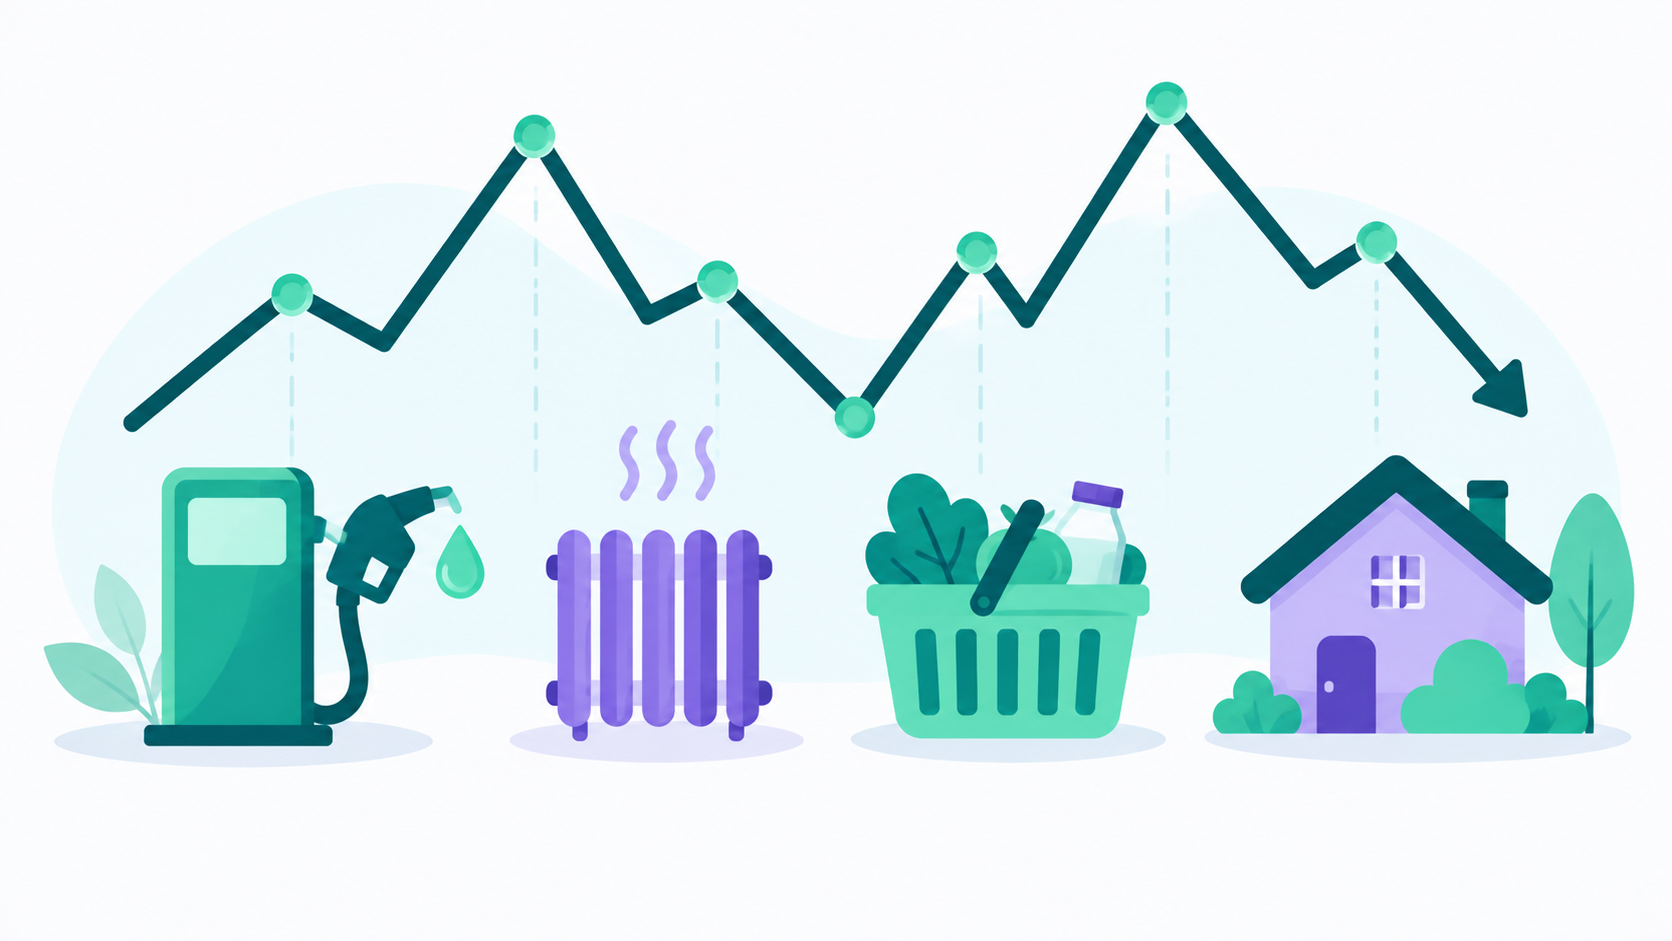
The energy shock from the conflict with Iran is showing up in your budget mainly through two lines: fuel and heating. As of the July 2026 CPI report, gasoline prices were up 24.6 percent year over year and fuel oil was up 39.1 percent, while headline inflation ran 3.4 percent and average wage growth ran 3.2 percent. For a typical driver, that works out to roughly $25 to $30 more a month at the pump than a year ago.
Everything below is current as of early September 2026, and this is a situation where the numbers have moved substantially month to month. Treat the figures as a snapshot and check current data before making any large decision based on them.
How much is this actually costing a typical household?
The clearest line is gasoline. The national average sat around $4.15 a gallon in early September 2026, which AAA noted was the highest September price on record. In January of this year it was about $2.84.
Put that against actual spending. Empower's analysis of user data found drivers nationwide spending an average of $139.45 a month at the pump in August 2026, at $48.44 per fill. A household that would have spent roughly $110 at January prices for the same gallons is now spending closer to $140, so the gap is somewhere around $30 a month, or $360 a year, for the same amount of driving.
Your number depends heavily on where you live and how much you drive. On September 4, California averaged $5.81 a gallon while Indiana averaged $3.45, a spread of well over $2. Someone commuting 40 miles a day in a high-cost state is absorbing several times the national average impact.
Here's the piece that makes it bite. Real average hourly earnings fell 0.2 percent between July 2025 and July 2026, meaning inflation has been running slightly ahead of wage growth. So this isn't only a prices story, it's a purchasing power story, and the squeeze is arithmetic rather than psychological.
Which parts of your budget are actually affected?
Fuel and heating carry most of it. Groceries and shipped goods carry a smaller, slower share. And a large part of the inflation you're feeling has nothing to do with the conflict at all, which is worth knowing before you blame the wrong line item.
Gasoline and diesel
Up 24.6 percent year over year as of July, though that's down from 26.7 percent in June, so the annual rate has started to ease even as the level stays high. Diesel matters even if you don't drive one, since it moves nearly everything you buy.
Heating
This is the exposure to plan for now rather than in November. Fuel oil was up 39.1 percent year over year in July, the largest increase in any major CPI category. European natural gas futures hit a three-year high in early September as renewed fighting raised concerns about winter supply, and while the U.S. market is more insulated than Europe's, natural gas is globally traded and prices move together to a degree.
If you heat with oil or propane, this is your biggest single exposure and it lands in one concentrated stretch of the year.
Groceries and shipped goods
Food inflation ran 3 percent year over year in July, with food away from home up 0.3 percent for the month. Fuel costs feed into this through freight, but the pass-through is slower and smaller than at the pump, and food prices are driven by many things besides energy.
What isn't driven by this
Shelter accounted for roughly two-thirds of July's monthly CPI increase and rose 3.2 percent year over year. That's a domestic housing supply and rent story, not an energy one. Medical care, insurance, and education have their own drivers too.
Being precise about this matters practically. If your budget is strained mostly by rent, cutting driving won't fix it, and you'll waste effort on the wrong lever. Separating your categories is what lets you tell the difference, which is a large part of why our piece on why most budgeting apps never move your savings rate argues that broad categories hide the information you actually need.
Why do these numbers keep swinging?
Because energy prices react to news rather than to fundamentals alone, and this conflict has produced a lot of news. The 2026 pattern is genuinely whiplash-inducing.
Gas averaged about $2.84 in January. By late February it was $2.98. A month later, in late March, it was $3.98, a full dollar increase in roughly four weeks as the conflict entered its second month. Prices peaked for the year at $4.55 on May 21. Then a ceasefire in April eased supply fears enough that June's CPI actually fell 0.4 percent month over month, the first monthly decline since May 2020. Renewed fighting followed, and by early September the average was back around $4.15 with Brent crude near $100 a barrel.
The underlying driver is the Strait of Hormuz, through which more than 20 percent of the world's traded oil normally passes. Its disruption was characterized by the International Energy Agency as the largest supply disruption in the history of the global oil market, and shipping traffic remained well below pre-war levels even during the ceasefire.
The budgeting lesson from that timeline isn't a forecast. It's that you should budget for a volatile input rather than for whatever this month's level happens to be, because anyone who rebuilt their entire budget around May's $4.55 would have been wrong by June, and anyone who relaxed in June was wrong by September.
How long do energy shocks like this usually last?
Historically, the sharp spike fades within months, though this disruption is larger than the usual comparison cases, so the pattern may not repeat cleanly.
The precedents are reasonably consistent. Congressional Research Service analysis found that oil prices rose sharply at the outset of the 1990 to 1991 Gulf War and returned to pre-crisis levels within a few months. A similar pattern followed the 2003 Iraq War. Brent crude reached nearly $130 a barrel after Russia's 2022 invasion of Ukraine and fell back over the following months. The risk premium from the June 2025 Israel-Iran conflict dissipated within days of that ceasefire.
Current forecasts diverge sharply, which is itself informative. J.P. Morgan Global Research estimated that Brent staying elevated through mid-year could depress first half 2026 global GDP growth by an annualized 0.6 percent, and analysts have suggested sustained $100 oil could add roughly 0.8 percent to global inflation. On the other side, some U.S. officials have publicly predicted oil falling as low as $40 to $50 a barrel once the conflict ends, on the view that a great deal of supply is coming online.
So nobody knows. Which means the sensible posture is to build a budget that survives either outcome rather than one that bets on a particular resolution.
What can you actually do about it?
Focus on the two or three lines that moved and leave the rest alone. Wholesale budget restructuring in response to a volatile input tends to create more disruption than the input did.
Recalculate your fuel line from actual receipts
Pull your last three months of fuel spending and compare it to the same months last year. Use the real number rather than an estimate, because estimates on this run high when prices are in the news and low when they aren't. If the increase is $30 a month, you now know exactly how much you need to find elsewhere.
Prepare the heating line before winter, not during it
This is the highest-value action available right now if you heat with oil, propane, or natural gas. Ask your utility about budget billing or level pay, which spreads annual heating costs evenly across twelve months and removes the January spike. Check whether pre-buy or price-lock options exist for oil and propane, and compare them carefully rather than assuming a lock is automatically better.
Weatherization is the boring, durable answer. Sealing drafts, adding insulation, and setting back the thermostat produce savings every year rather than one time. Many utilities and state programs offer free or subsidized energy audits.
And check assistance eligibility even if you've never qualified before. The Low Income Home Energy Assistance Program helps with heating costs, income thresholds and funding vary by state, and applications often open in the fall. Dialing 211 or visiting 211.org connects you to local utility assistance programs, which is worth ten minutes before the cold arrives.
Don't over-correct
Selling a vehicle, breaking a lease, or making a large irreversible decision based on a fuel price that has swung between $2.81 and $4.55 within one calendar year is usually a mistake. The costs of reversing those decisions are high and the input is genuinely unpredictable.
Protect the cushion first
If you have savings, this is exactly the situation it exists for, and drawing on it to absorb a temporary energy spike is the fund working correctly. If you don't, a small one is worth building even now. Urban Institute research found that families with as little as $250 to $749 saved were less likely to be evicted or miss a housing or utility payment after an income disruption. Our guide to starting an emergency fund when you're already behind covers building that first tier without waiting for conditions to improve.
How do you track a cost that keeps moving?
Split fuel and heating into their own subcategories and compare month over month rather than against a budget you set in January. When the input is this volatile, a fixed budget target tells you almost nothing while a trend line tells you everything.
The structure is what makes this readable. A single "Transportation" category lumps a fuel increase in with insurance, maintenance, and a car payment, so the total moves and you can't tell why. Lucky Friday lets you create unlimited custom categories and subcategories with your own icons and colors, so you can separate fuel from vehicle costs and heating from other utilities, then read each independently. Selecting any past month or year lets you compare this September against last September directly, which is the comparison that actually answers the question. All of that sits on the permanently free tier, with no category limits and no credit card required.
Two features earn their keep here specifically. Category rules mean fuel purchases file themselves rather than needing manual sorting every week. And the monthly and annual toggle matters because $30 a month reads as noise while $360 a year is a decision. If you'd rather have transactions import automatically than enter them by hand, bank sync through Plaid is available on the premium plan.
If your income is variable, which makes absorbing an energy shock harder, our approach to budgeting on an irregular income covers setting category amounts against your leanest recent period rather than your average.
Common Questions About the Iran War and Your Budget
How much are gas prices up because of the Iran conflict?
Gasoline was up 24.6 percent year over year as of the July 2026 CPI report, easing slightly from 26.7 percent in June. The national average sat around $4.15 a gallon in early September, compared with roughly $2.84 in January 2026. Your local impact varies widely, with state averages ranging from about $3.45 to $5.81.
Is this energy shock causing overall inflation?
Partly, though less than people assume. Headline inflation ran 3.4 percent year over year in July, and shelter alone accounted for roughly two-thirds of that month's increase, which is a domestic housing issue rather than an energy one. Energy is driving the gasoline and fuel oil lines sharply, while the broader inflation picture has several separate causes.
Should I change my budget because of the war?
Adjust the specific lines that moved, mainly fuel and heating, and leave the rest alone. Prices have swung between roughly $2.81 and $4.55 a gallon within this calendar year, so restructuring around any single month's level is likely to be wrong within a quarter. Budget for volatility rather than for a particular price.
How long will high energy prices last?
Nobody knows, and current forecasts diverge widely. Historically, oil price spikes from conflicts have faded within months, as they did after the 1990 Gulf War, the 2003 Iraq War, and the 2022 invasion of Ukraine. This disruption is larger than those comparisons, so the historical pattern is a guide rather than a prediction.
What should I do about heating costs this winter?
Act before the cold rather than during it. Ask your utility about budget billing to spread costs evenly across the year, look into weatherization and free energy audits, and check assistance eligibility through LIHEAP or by calling 211 even if you haven't qualified before. Fuel oil was up 39.1 percent year over year in July, which makes this the largest single exposure for households heating with oil or propane.
Sources
U.S. Bureau of Labor Statistics. "Consumer Price Index Summary, July 2026." Released August 12, 2026. https://www.bls.gov/news.release/cpi.nr0.htm
Trading Economics, summarizing BLS July 2026 CPI detail including gasoline and fuel oil year over year figures. https://tradingeconomics.com/united-states/inflation-cpi
AAA. "State Gas Price Averages," daily national and state averages. https://gasprices.aaa.com/state-gas-price-averages/
AAA. "National Gas Average Jumps One Dollar in One Month," March 26, 2026. https://gasprices.aaa.com/national-gas-average-jumps-one-dollar-in-one-month/
Empower. "Average gas prices by state," including monthly household pump spending data, September 2026. https://www.empower.com/the-currency/money/gas-prices-by-state-news
Bloomberg. "Energy Prices Surge as Iran Conflict Threatens Oil, Gas Supplies for Winter," September 2, 2026. https://www.bloomberg.com/news/articles/2026-09-02/energy-prices-surge-as-politicians-sound-alarm-ahead-of-winter
J.P. Morgan Global Research. "US–Israel Military Operation Against Iran: Are Markets on Edge?" https://www.jpmorgan.com/insights/global-research/commodities/iran-us-tensions-market-effect
Morgan Stanley. "Iran Conflict: Oil Price Impacts and Inflation." https://www.morganstanley.com/insights/articles/iran-war-oil-inflation-stock-market-2026
Historical oil shock comparisons and IEA characterization of the supply disruption, compiled at https://en.wikipedia.org/wiki/Economic_impact_of_the_2026_Iran_war
Urban Institute. "Why Cities Should Care about Family Financial Security." https://www.urban.org/features/why-cities-should-care-about-family-financial-security